Sources


Number of passengers per station - 2014
Antwerp-Central Station remained the most popular train station in 2019 with 63% of all boarding passengers, followed by Antwerpen-Berchem (27%) and Antwerpen-Zuid (5%).
Commercial car sharing began in 2005. The offer available has increased significantly since 2017. Users have increasingly turned to commercial and private car sharing systems since 2019. A greater provision of shared cars has led to a greater number of users.
De Lijn subscriptions
Bicycle bus passengers
Waterbus passengers
Ferry passengers
Number of journeys per category
Number of vehicles per category
Number of passengers per station - 2019
Pedestrians
Based on the figures from ANPR cameras on the main routes to Antwerp, it appears that the number of cars entering the city has been declining over the past few years. In 2020, an incredible 10% less congestion was recorded on Antwerp's road network compared to 2019.
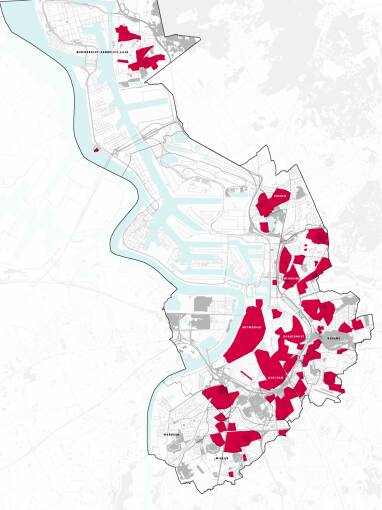
Between 2010 and 2020, the area of 30 km/hr zones in the city of Antwerp increased from 15.7% to 42.9%. This means that almost all residential areas in Antwerp have become a 30 speed limit zone. Higher speeds are only allowed on the main traffic routes.
Public transport
Travellers use the train more frequently. This also caused a rise in the use of smaller stations in the city of Antwerp. The number of train passengers grew on weekdays in particular, however, more people travelled by train on Saturdays and Sundays as well.
Over the past years, the city added extra public transport solutions, such as a waterbus, bicycle bus and a ferry at Sint-Anna. These created an efficient connection with the port in particular. They were successful right from day one. The coronavirus measures in 2020 had very little impact on the number of passengers using the bicycle bus and waterbus.
Cyclists
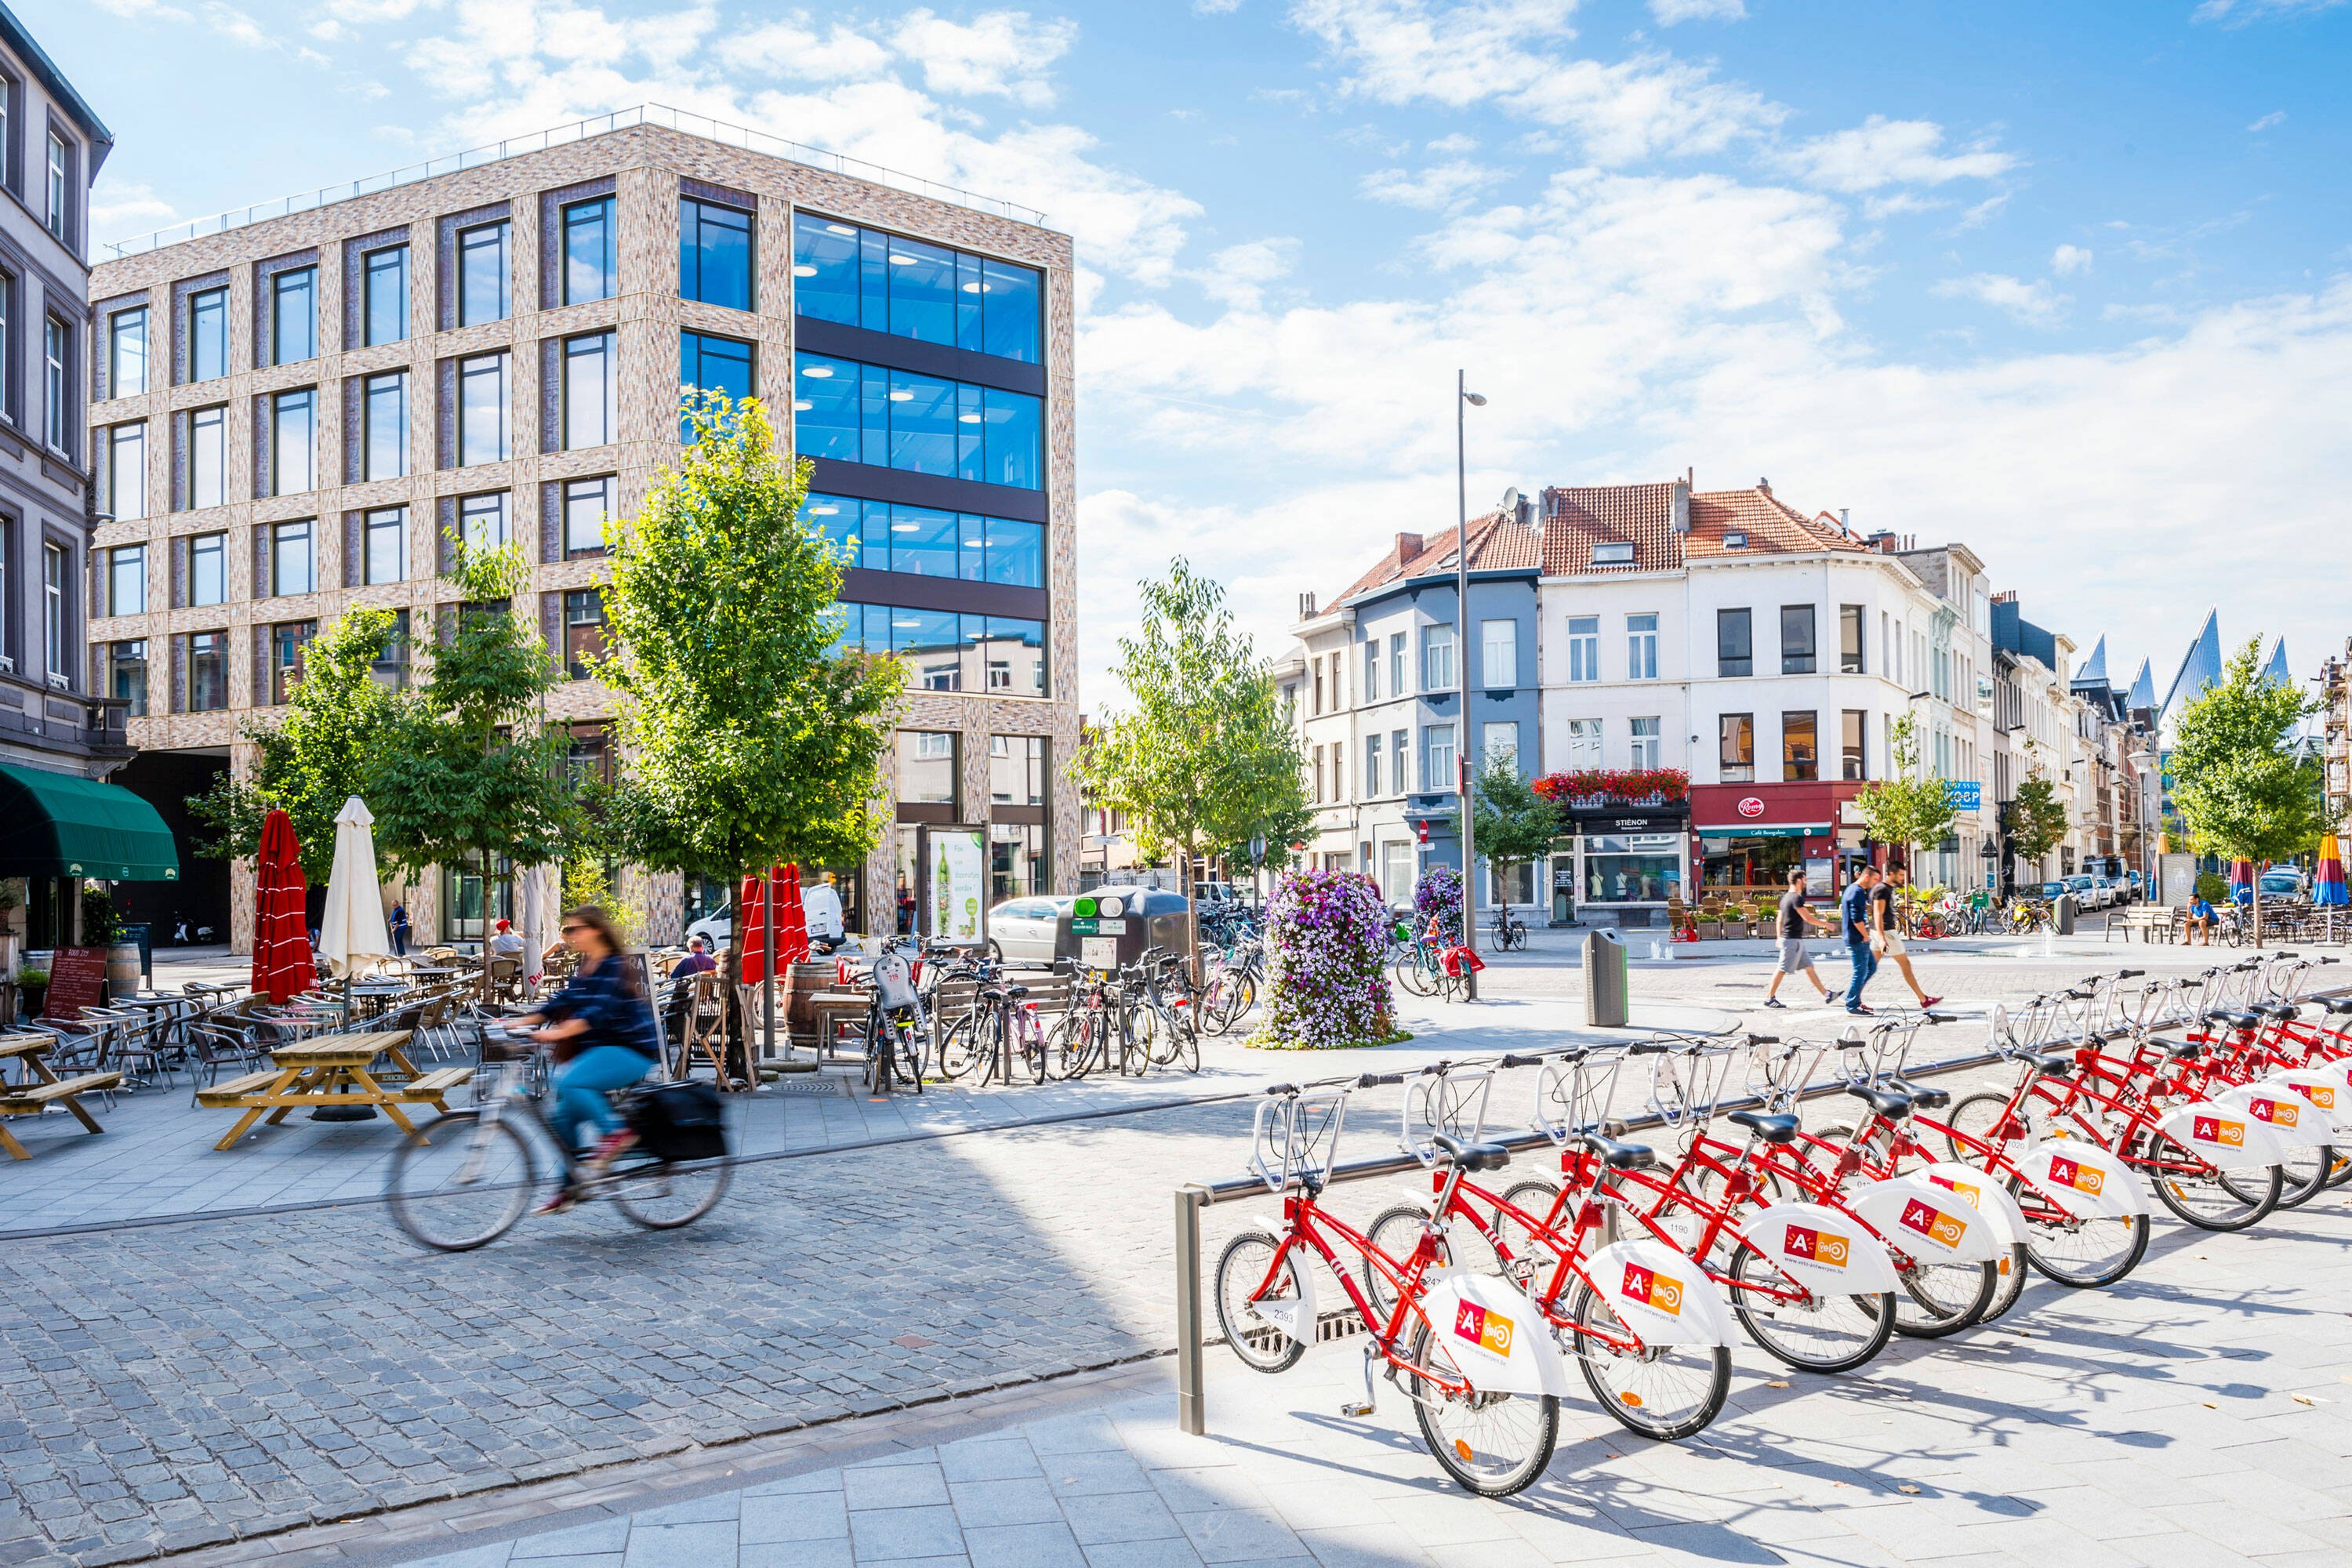
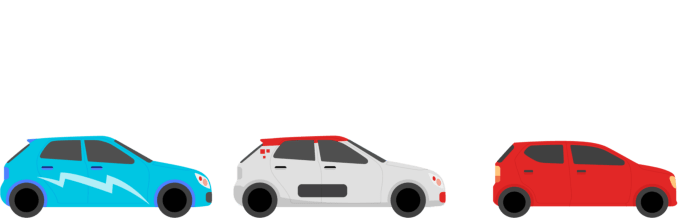
Shared mobility
The shared car figures from 2010 to 2012 are estimates
Public transport
Cars
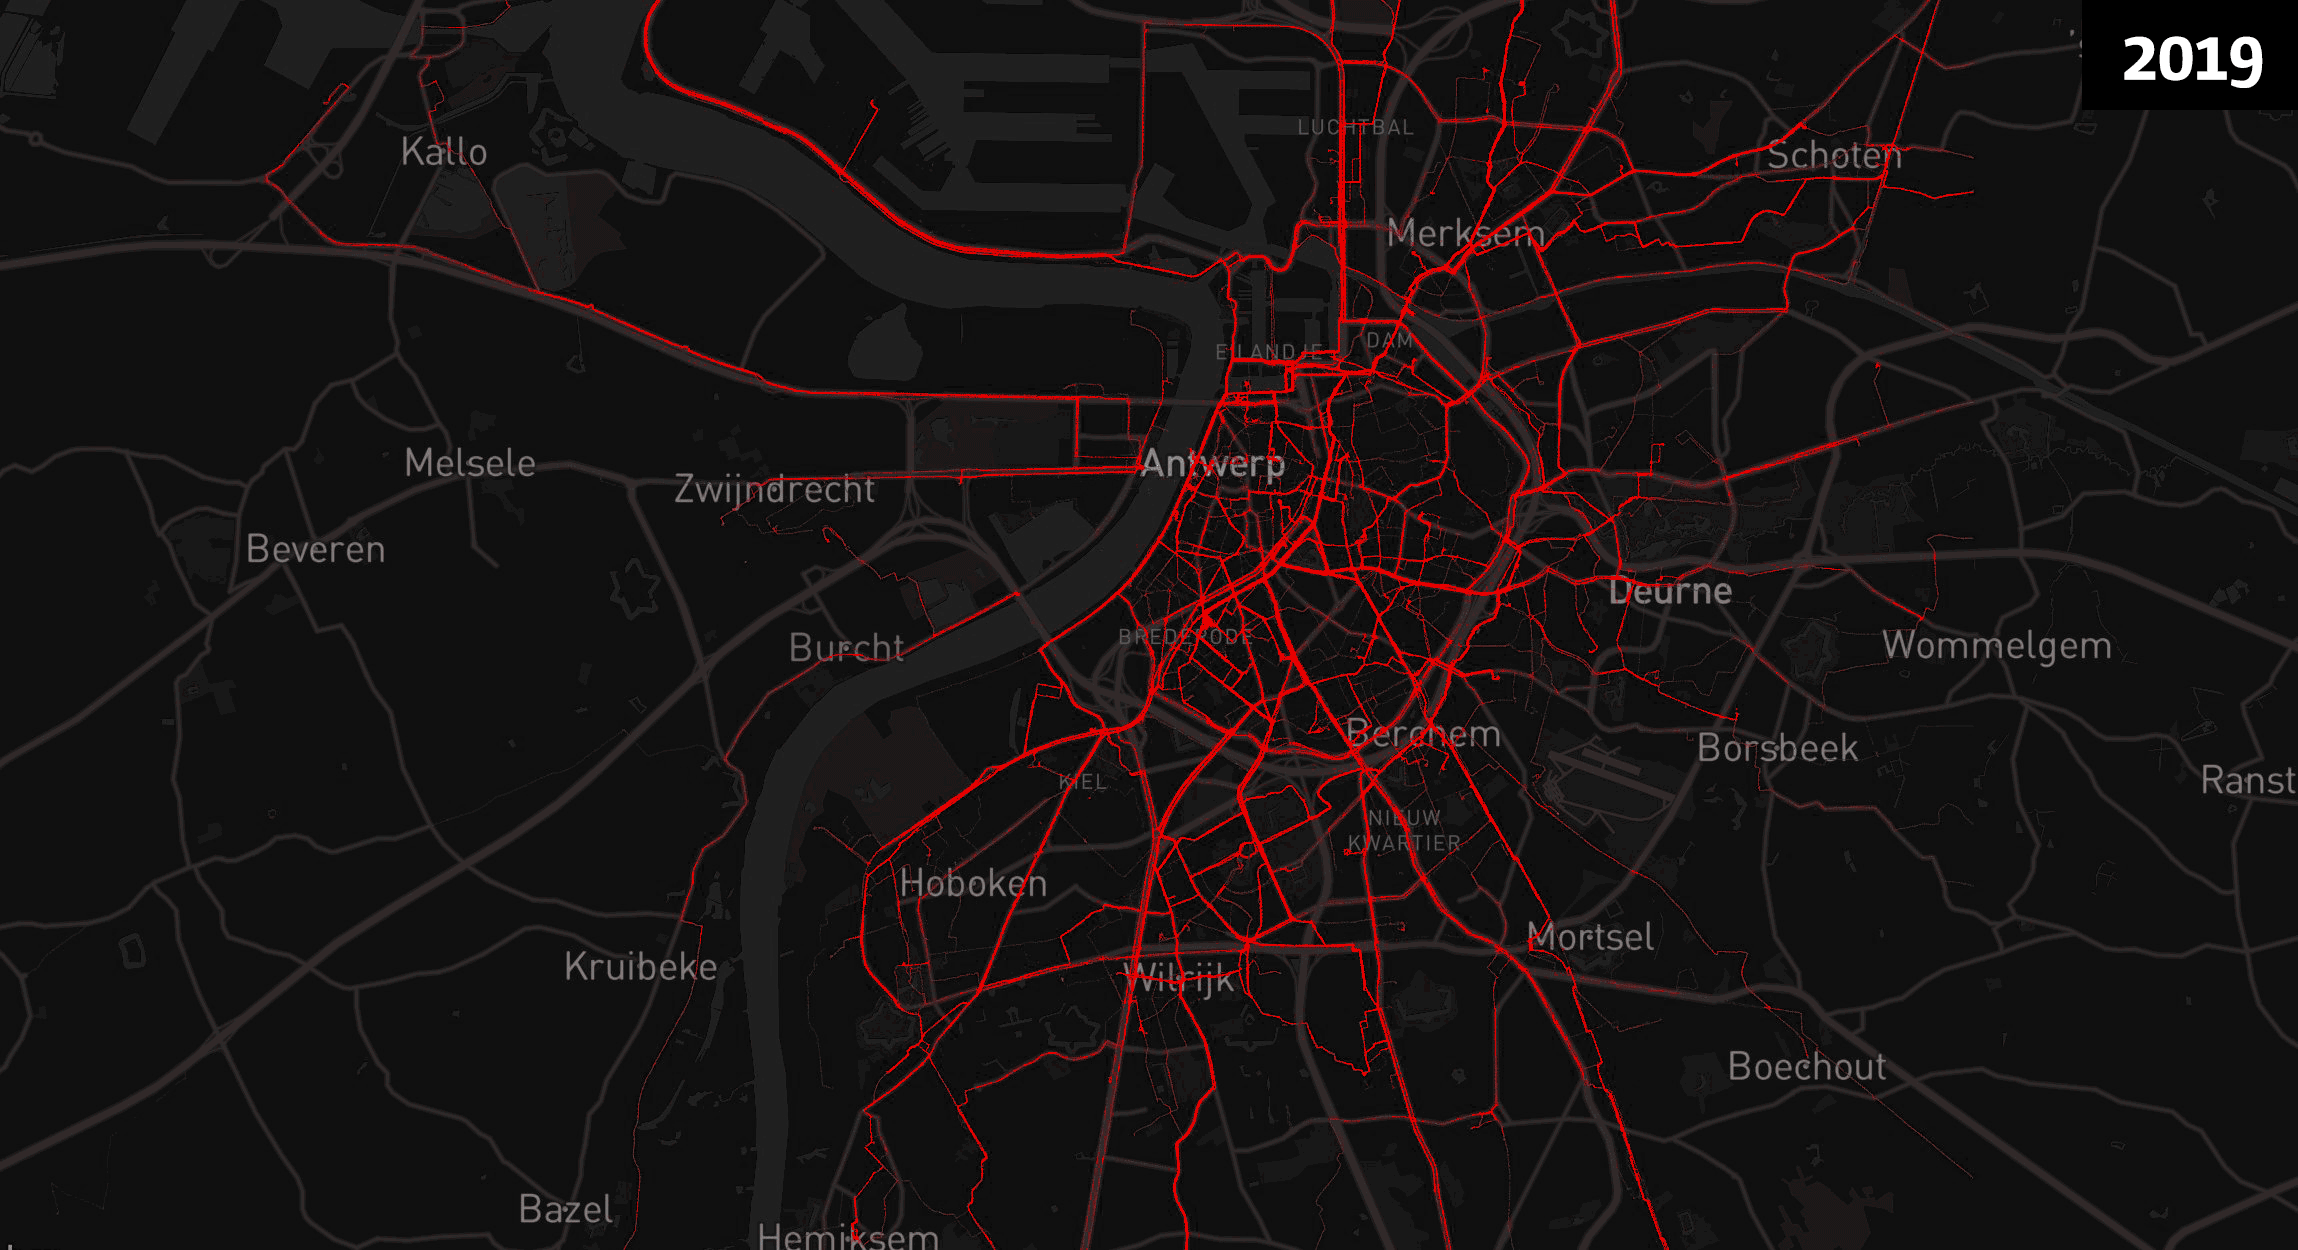
Most popular cycle routes in Antwerp
Shared mobility


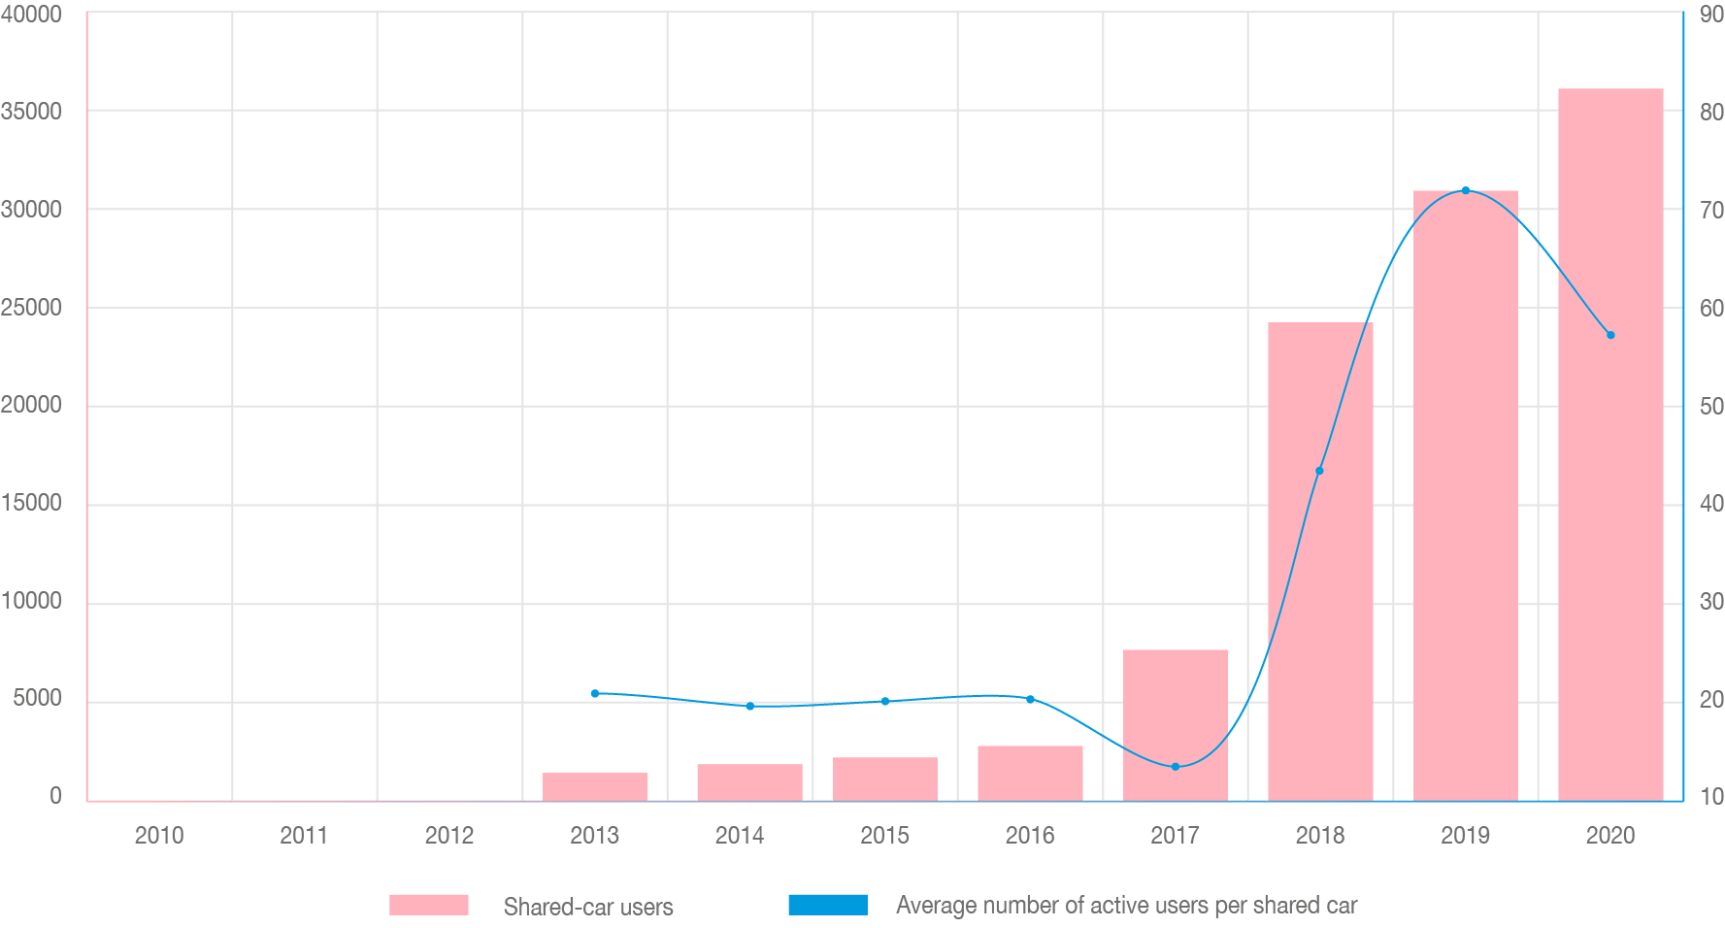
If all Antwerp shared-car users were to park their own car, the line would stretch for 145 km. That is twice the length of the Belgian coastline.
that 5,000 to 15,000 people make use of Velo every day, depending on the season, the weather and the day of the week?

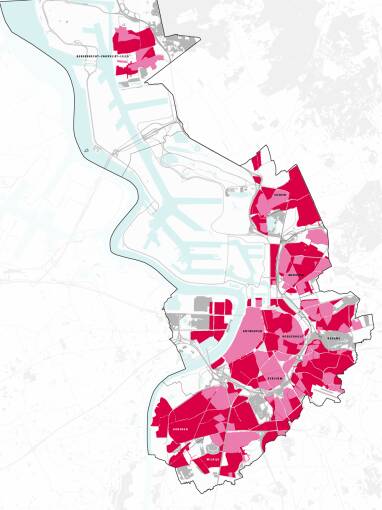
52% of the regular cyclists in Antwerp are women? In Brussels, 36% are women, and in the Netherlands 55%. This demonstrates, among other things, that Antwerp is a pleasant and safe place for cycling.
*Start of Sint-Anna ferry service in July 2017
30 km/hr zones in Antwerp (2010 compared to 2020)
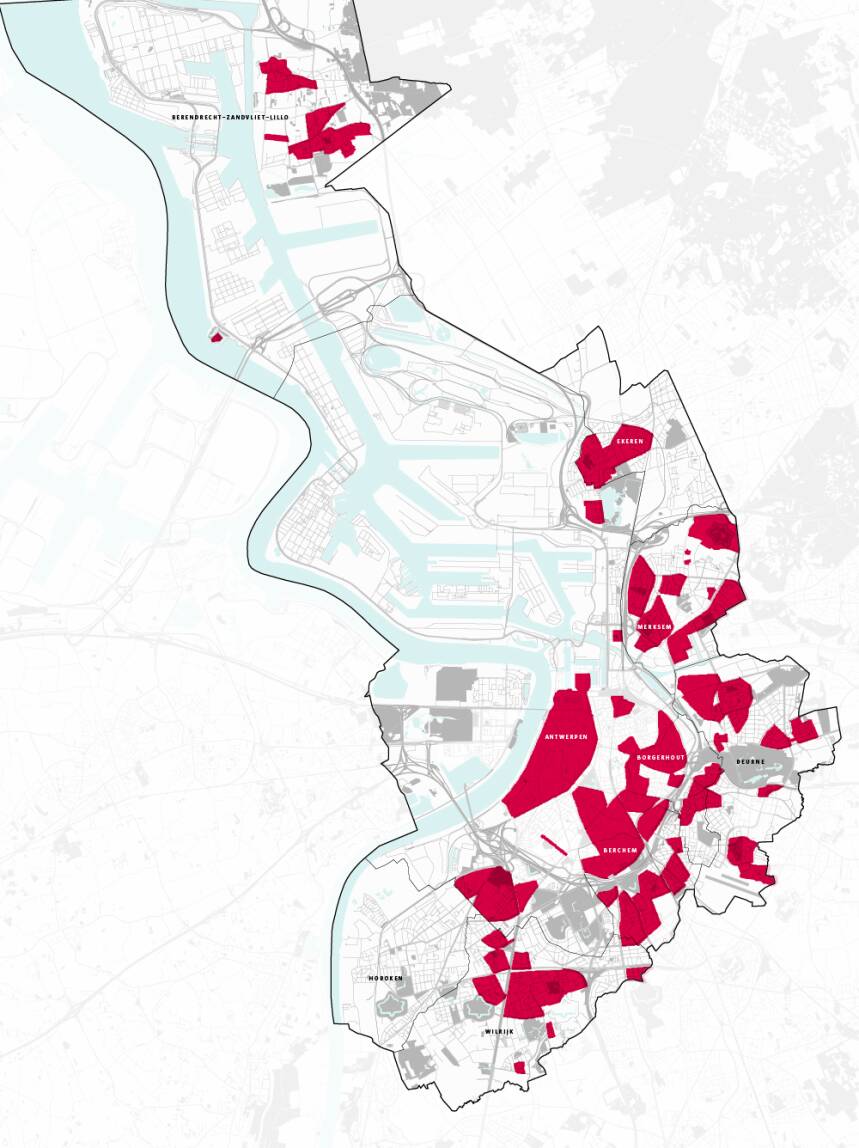

Antwerp was the first Flemish city to introduce a 30 km/hr zone in all residential areas?
*The 2019 figure is an estimate


that the number of passengers using the waterbus in 2020 is equivalent to 188 times the Titanic?
More and more journeys in Antwerp were made by bike, and this was also confirmed by the permanent bike-registration posts. The registration posts in Mercatorstraat and along the Kaaien show a clear increase in the number of cyclists per month. In 2020, more than 8 million cyclists passed the 13 registration posts.
In an effort to provide room for all cyclists in the city, the city of Antwerp has invested heavily in new and connecting cycle paths. In 2020, the city had 648 kilometres of cycle paths. In comparison: Amsterdam had 736 kilometres of cycle paths in 2019. The heat maps demonstrate, e.g., increasing bike traffic on the 'fietsostrades' (cycle highways).
Cyclists
Pedestrians
Antwerp charted 714 km of slow roads in 2020. Here, motorised traffic is unwelcome, allowing vulnerable road users to walk or cycle in safety. In 2020, the city had, e.g., 42 kilometres of pedestrian zones and another 48 kilometres of residential areas.
During the coronavirus period, Antwerp residents spent more time than ever walking. This meant the percentage of walking in the modal split (the ratio between the types of transport) increased to more than 10% during leisure time.
Shared bikes in particular have become very popular in Antwerp in recent years. They started at an early stage in 2011 with the launch of the Velo city bikes. Several providers of shared bikes without fixed parking infrastructure joined later on.
Every year, millions of journeys are made with Velo bikes in the city. In 2020, this amounted to more than 4 million. Blue-bike recorded more than 30,000 bike journeys in Antwerp in 2019. Following the launch of shared bikes and cars, the first electric shared mopeds were launched in 2017 and electric shared scooters in 2018. In 2021, the number of shared vehicles will exceed 9,000.


Sources
*Start of Sint-Anna ferry service in July 2017
Ferry passengers
Bicycle bus passengers
Waterbus passengers
De Lijn subscriptions
Travellers use the train more frequently. This also caused a rise in the use of smaller stations in the city of Antwerp. The number of train passengers grew on weekdays in particular, however, more people travelled by train on Saturdays and Sundays as well.
Over the past years, the city added extra public transport solutions, such as a waterbus, bicycle bus and a ferry at Sint-Anna. These created an efficient connection with the port in particular. They were successful right from day one. The coronavirus measures in 2020 had very little impact on the number of passengers using the bicycle bus and waterbus.
Public transport
Antwerp was the first Flemish city to introduce a 30 km/hr zone in all residential areas?
Antwerp-Central Station remained the most popular train station in 2019 with 63% of all boarding passengers, followed by Antwerpen-Berchem (27%) and Antwerpen-Zuid (5%).
30 km/hr zones in Antwerp (2010 compared to 2020)

Based on the figures from ANPR cameras on the main routes to Antwerp, it appears that the number of cars entering the city has been declining over the past few years. In 2020, an incredible 10% less congestion was recorded on Antwerp's road network compared to 2019.
Between 2010 and 2020, the area of 30 km/hr zones in the city of Antwerp increased from 15.7% to 42.9%. This means that almost all residential areas in Antwerp have become a 30 speed limit zone. Higher speeds are only allowed on the main traffic routes.
Cars
Public transport
Shared mobility
Cyclists
Pedestrians
that the number of passengers using the waterbus in 2020 is equivalent to 188 times the Titanic?
Number of passengers per station - 2019
Antwerp charted 714 km of slow roads in 2020. Here, motorised traffic is unwelcome, allowing vulnerable road users to walk or cycle in safety. In 2020, the city had, e.g., 42 kilometres of pedestrian zones and another 48 kilometres of residential areas.
During the coronavirus period, Antwerp residents spent more time than ever walking. This meant the percentage of walking in the modal split (the ratio between the types of transport) increased to more than 10% during leisure time.
Pedestrians
52% of the regular cyclists in Antwerp are women? In Brussels, 36% are women, and in the Netherlands 55%. This demonstrates, among other things, that Antwerp is a pleasant and safe place for cycling.
Most popular cycle routes in Antwerp
*The 2019 figure is an estimate

More and more journeys in Antwerp were made by bike, and this was also confirmed by the permanent bike-registration posts. The registration posts in Mercatorstraat and along the Kaaien show a clear increase in the number of cyclists per month. In 2020, more than 8 million cyclists passed the 13 registration posts.
In an effort to provide room for all cyclists in the city, the city of Antwerp has invested heavily in new and connecting cycle paths. In 2020, the city had 648 kilometres of cycle paths. In comparison: Amsterdam had 736 kilometres of cycle paths in 2019. The heat maps demonstrate, e.g., increasing bike traffic on the 'fietsostrades' (cycle highways).
Cyclists
The shared car figures from 2010 to 2012 are estimates

Number of passengers per station - 2014
Number of vehicles per category
Shared mobility
Shared bikes in particular have become very popular in Antwerp in recent years. They started at an early stage in 2011 with the launch of the Velo city bikes. Several providers of shared bikes without fixed parking infrastructure joined later on.
Every year, millions of journeys are made with Velo bikes in the city. In 2020, this amounted to more than 4 million. Blue-bike recorded more than 30,000 bike journeys in Antwerp in 2019. Following the launch of shared bikes and cars, the first electric shared mopeds were launched in 2017 and electric shared scooters in 2018. In 2021, the number of shared vehicles will exceed 9,000.
that 5,000 to 15,000 people make use of Velo every day, depending on the season, the weather and the day of the week?
If all Antwerp shared-car users were to park their own car, the line would stretch for 145 km. That is twice the length of the Belgian coastline.
Number of journeys per category
Commercial car sharing began in 2005. The offer available has increased significantly since 2017. Users have increasingly turned to commercial and private car sharing systems since 2019. A greater provision of shared cars has led to a greater number of users.