Sources

Number of residents
Average length of congestion on the Ring Road in kilometres

In order to prevent traffic, for example, looking for an available parking space, the city is investing heavily in neighbourhood car parks, public car parks, park and rides, and underground car parks in the case of new building projects. This liberates more space on the street for walking, cycling and shared mobility.
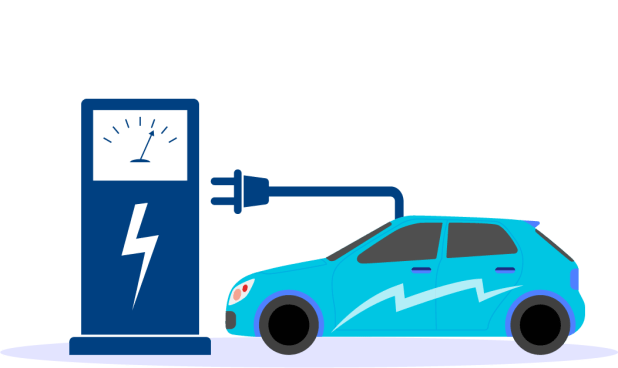
Increasing numbers of charging points for electric cars are being provided in public car parks. The city calculates this in ‘charging equivalents’. Fast chargers count for 10 charging equivalents and standard charging points count for 2. In 2020, the city had 450 charging equivalents.
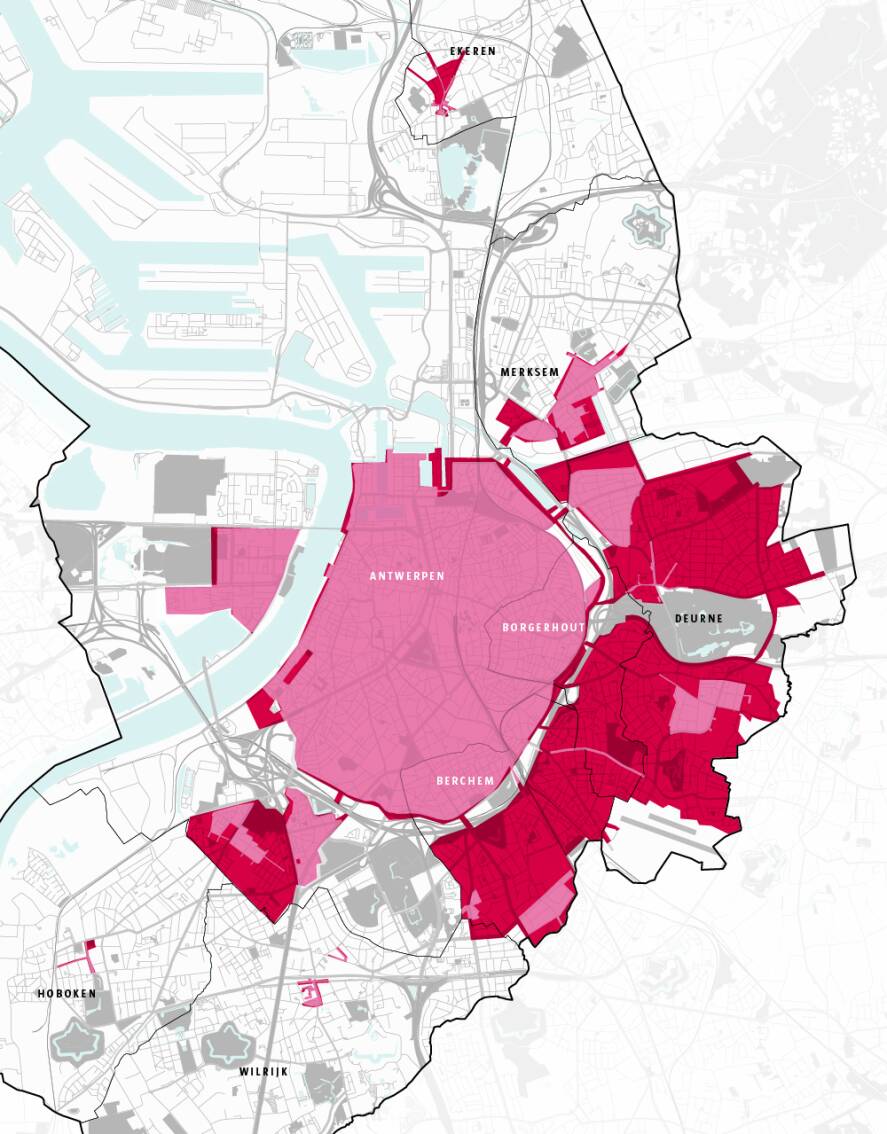
Limited car parking has been extended over the years to new and larger zones, to keep the streets pleasant and accessible to people living in Antwerp. In 2013, 14.1% of city parking was paying or disk parking, in 2020 this increased to 23.3%.
Number of jobs
Parking spaces in local car parks
*2012 is approximate
Registered cars

Total number of shared mobility vehicles
Electrical charging equivalents
Average number of boarding train passengers on weekdays
*The 2019 figure is an estimate
Parking


Key figures
The city of Antwerp has been working hard in recent years to transform the city's mobility. Mobility data over the last 10 years clearly show that this approach is paying off. Monitoring and evaluation have been an essential part of this process. In the coming years, the city plans to continue its efforts in data-driven mobility.
This report reviews the key mobility figures from the last 10 years. Over this period, there were a number of important transitions, each of which affected the city's mobility. At the same time, there was interaction with several reinforcing factors: demographic growth, technological progress, large investments in mobility infrastructure, shifting preferences towards the sharing economy and shared mobility in particular, growing awareness of the issues relating to traffic and the climate, new consultation bodies involving citizens and authorities, and even a pandemic.
Antwerp is working with citizens, partners, local authorities, stakeholders and companies to make the streets more suited to human life. Technology is playing an important role. A broad selection of transport opportunities, offered in an accessible manner, help users to make a conscious and reasoned choice.
Meanwhile, mobility data help the city to take mobility in an even better, more efficient direction. The rate of innovation in technology is going ever faster, and this will continue. By learning from the past, Antwerp is preparing for the future.

By 2030, Antwerp will be home to about 558,000 people. That is about 28,000 more residents than in 2019 and about 65,000 more residents than in 2010. The city's facilities will have to grow along with the number of residents, also in terms of mobility. It is therefore interesting to evaluate how mobility has evolved in the last 10 years. Which trends have emerged? And where are extra efforts required?
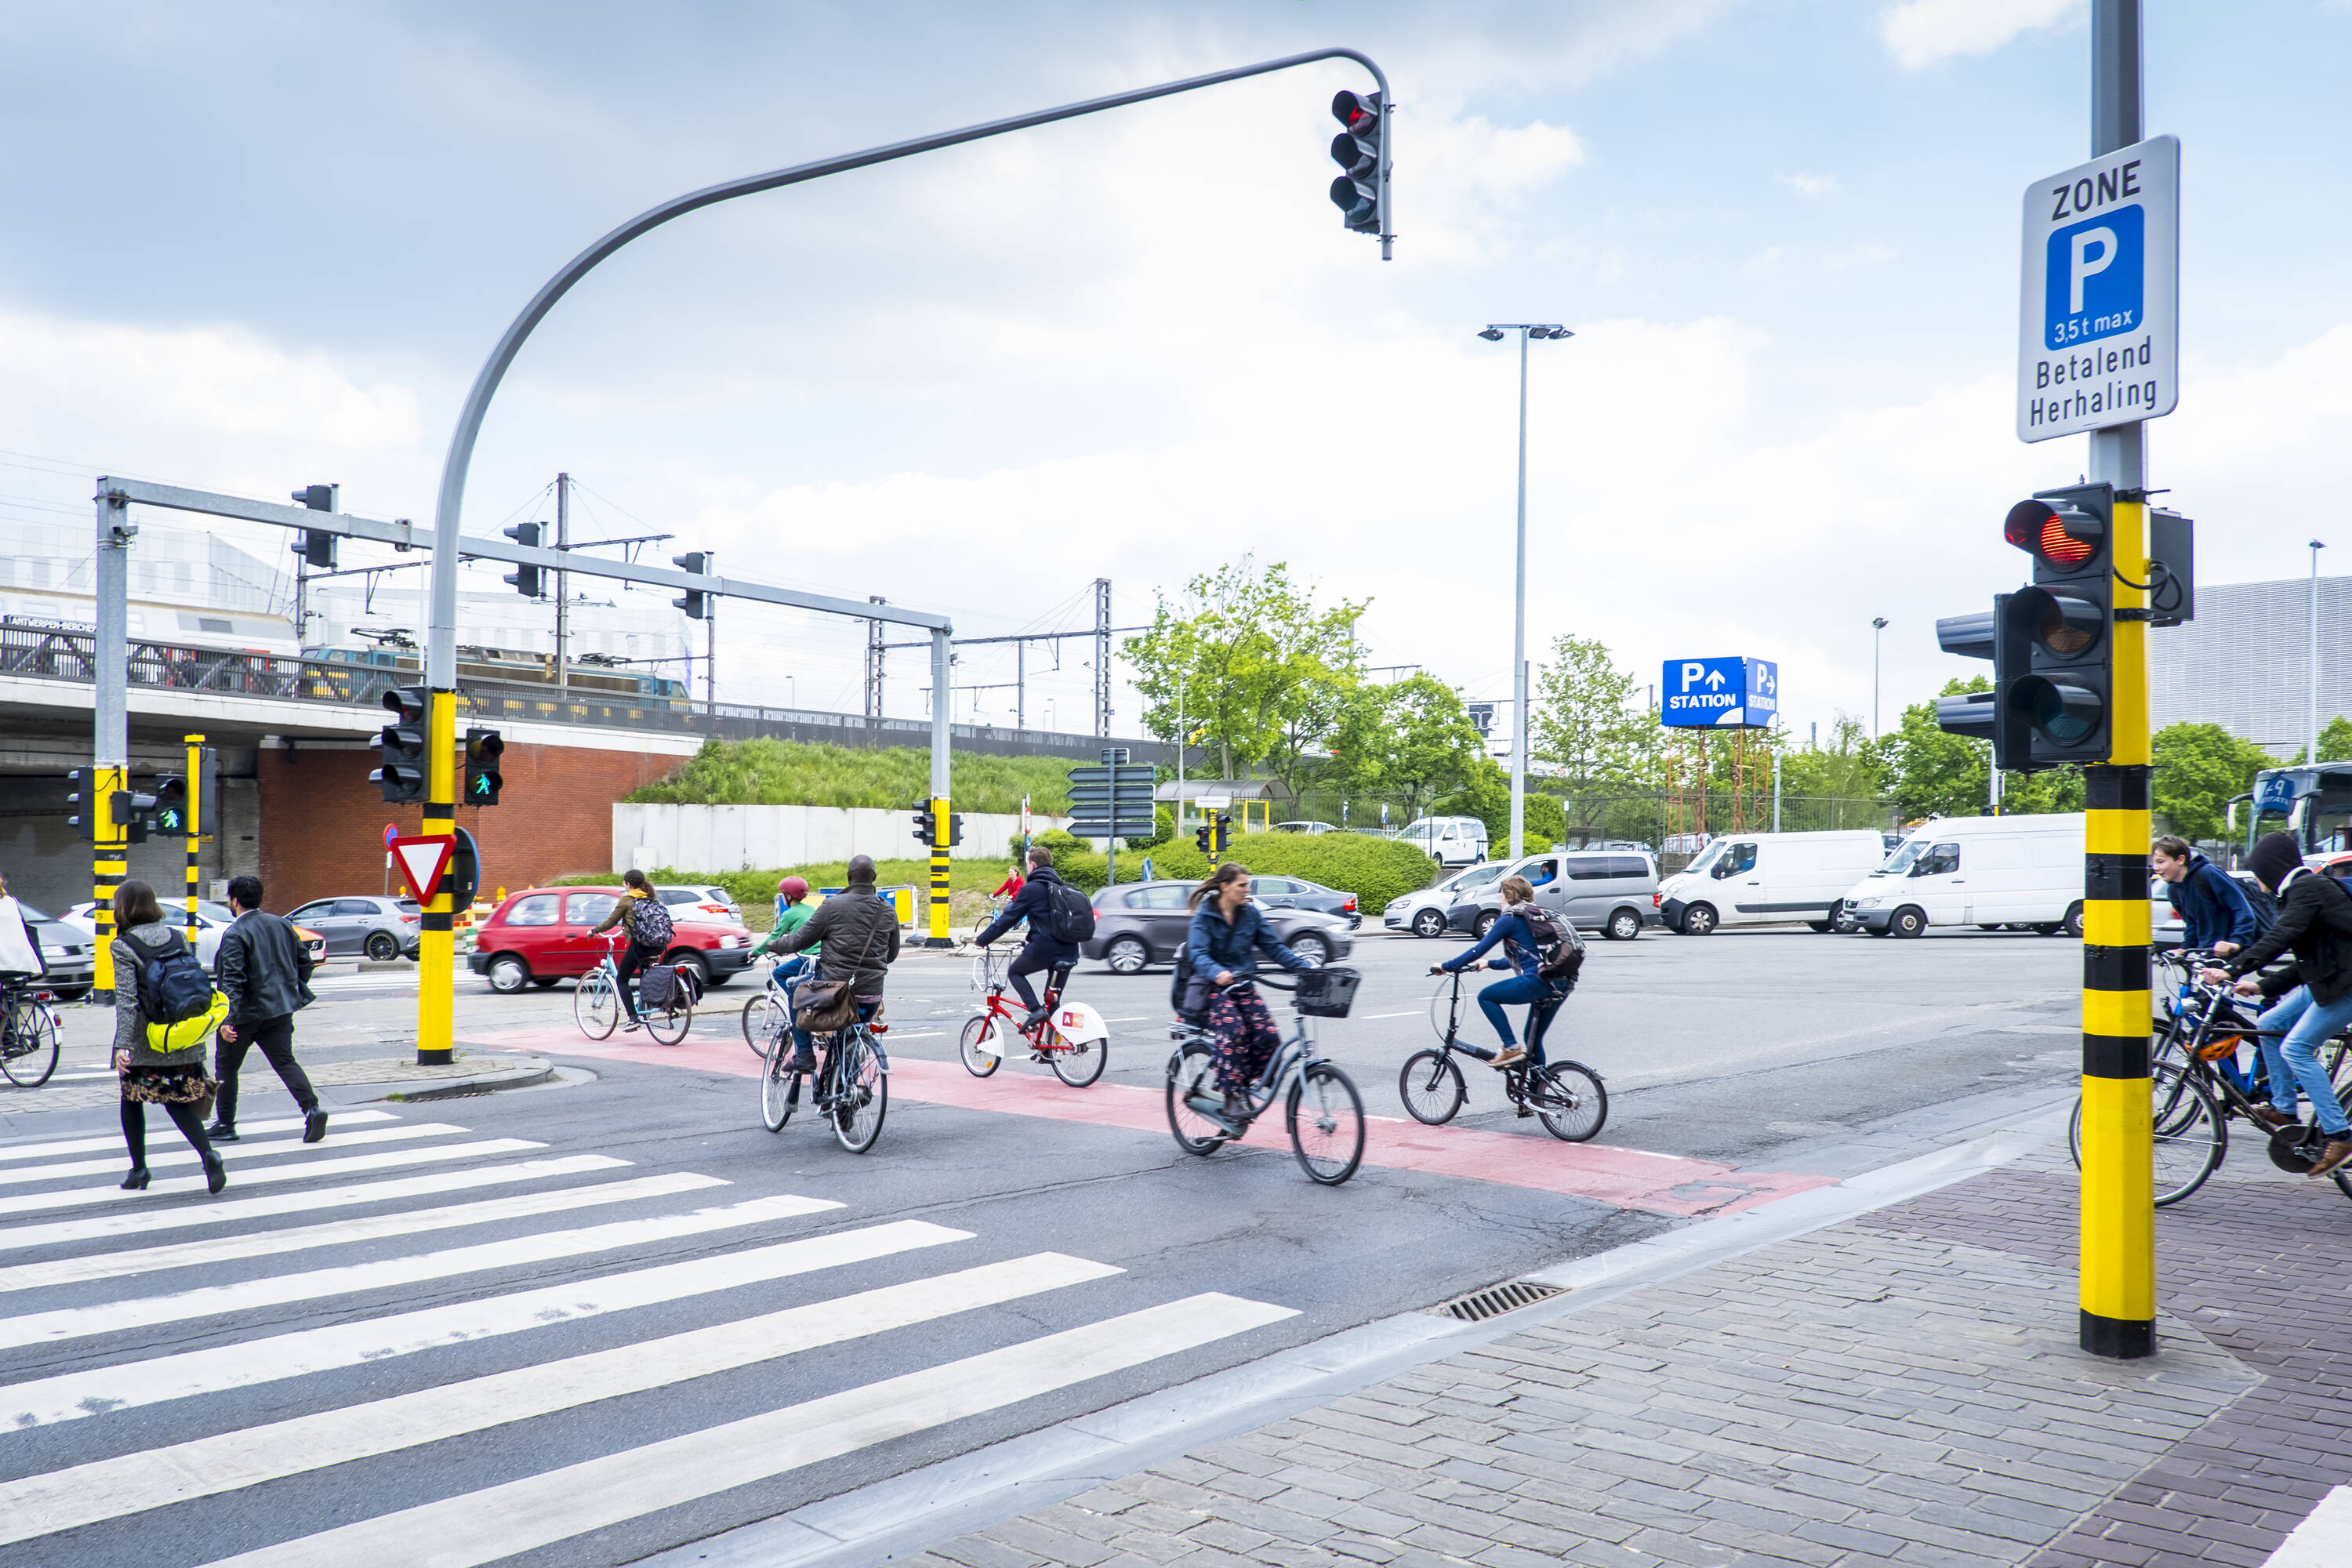
In the past few years, increasing numbers of residents, visitors and employees in Antwerp have been choosing to travel by bike, public transport or use a combination of transport methods. In the same period, the city of Antwerp has also made significant investments to increase the provision of electric shared scooters, bikes, mopeds and cars. Furthermore, the city has made it easier for users to choose and combine the most suitable methods for travel.
The coronavirus outbreak in 2020 shook up mobility in Antwerp. During that year, the average traffic jam on the Ring Road was halved partly due to the large amount of teleworking. Time will tell whether this was a temporary phenomenon or the start of a sustainable trend.
Introduction
Total number of passing cyclists (Mercatorstraat and Kaaien)
Parking zones 2013


Key figures
Parking zones 2020
more cyclists recorded in 2020 vs 2015
more residents in 2019 vs 2010
extra shared mobility vehicles in 2020 vs 2010
average length of congestion in 2020 vs 2019

employees expect to work from home at least once a week in the post- coronavirus period
more jobs in 2019 vs 2010
more boarding train passengers in 2019 vs 2014
Sources
Parking zones 2020
*2012 is approximate
Total number of passing cyclists (Mercatorstraat and Kaaien)
*2020 figures not yet available
*2020 figures not yet available
Total number of shared mobility vehicles
Average number of boarding train passengers on weekdays
Registered cars
Average length of congestion on the Ring Road in kilometres
Number of jobs
*2020 figures not yet available
Number of residents
By 2030, Antwerp will be home to about 558,000 people. That is about 28,000 more residents than in 2019 and about 65,000 more residents than in 2010. The city's facilities will have to grow along with the number of residents, also in terms of mobility. It is therefore interesting to evaluate how mobility has evolved in the last 10 years. Which trends have emerged? And where are extra efforts required?
In the past few years, increasing numbers of residents, visitors and employees in Antwerp have been choosing to travel by bike, public transport or use a combination of transport methods. In the same period, the city of Antwerp has also made significant investments to increase the provision of electric shared scooters, bikes, mopeds and cars. Furthermore, the city has made it easier for users to choose and combine the most suitable methods for travel.
The coronavirus outbreak in 2020 shook up mobility in Antwerp. During that year, the average traffic jam on the Ring Road was halved partly due to the large amount of teleworking. Time will tell whether this was a temporary phenomenon or the start of a sustainable trend.
Key figures

Introduction
The city of Antwerp has been working hard in recent years to transform the city's mobility. Mobility data over the last 10 years clearly show that this approach is paying off. Monitoring and evaluation have been an essential part of this process. In the coming years, the city plans to continue its efforts in data-driven mobility.
This report reviews the key mobility figures from the last 10 years. Over this period, there were a number of important transitions, each of which affected the city's mobility. At the same time, there was interaction with several reinforcing factors: demographic growth, technological progress, large investments in mobility infrastructure, shifting preferences towards the sharing economy and shared mobility in particular, growing awareness of the issues relating to traffic and the climate, new consultation bodies involving citizens and authorities, and even a pandemic.
Antwerp is working with citizens, partners, local authorities, stakeholders and companies to make the streets more suited to human life. Technology is playing an important role. A broad selection of transport opportunities, offered in an accessible manner, help users to make a conscious and reasoned choice.
Meanwhile, mobility data help the city to take mobility in an even better, more efficient direction. The rate of innovation in technology is going ever faster, and this will continue. By learning from the past, Antwerp is preparing for the future.
Key figures
*The 2019 figure is an estimate
Parking zones 2013

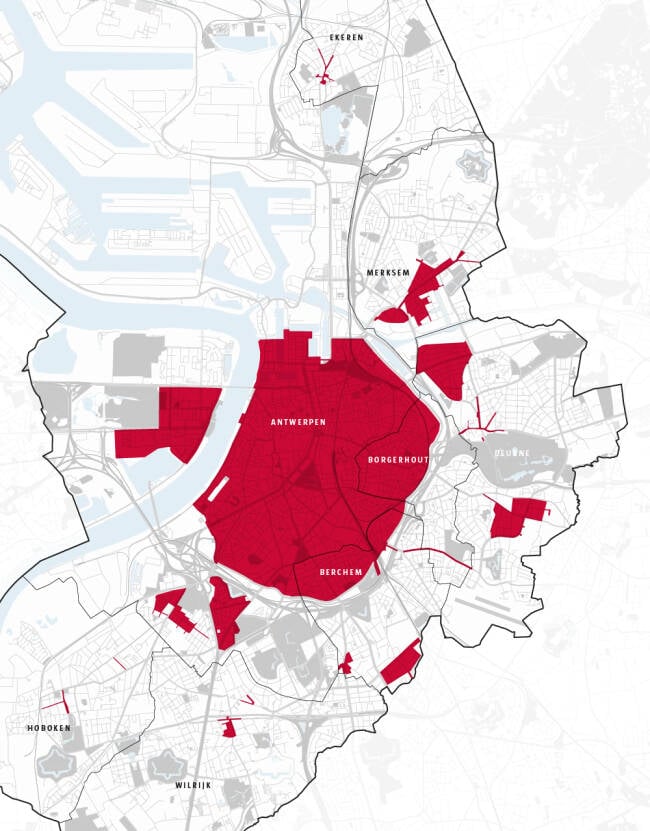
Limited car parking has been extended over the years to new and larger zones, to keep the streets pleasant and accessible to people living in Antwerp. In 2013, 14.1% of city parking was paying or disk parking, in 2020 this increased to 23.3%.
Electrical charging equivalents
Parking spaces in local car parks
In order to prevent traffic, for example, looking for an available parking space, the city is investing heavily in neighbourhood car parks, public car parks, park and rides, and underground car parks in the case of new building projects. This liberates more space on the street for walking, cycling and shared mobility.
Increasing numbers of charging points for electric cars are being provided in public car parks. The city calculates this in ‘charging equivalents’. Fast chargers count for 10 charging equivalents and standard charging points count for 2. In 2020, the city had 450 charging equivalents.
Parking
employees expect to work from home at least once a week in the post- coronavirus period


more residents in 2019 vs 2010
more cyclists recorded in 2020 vs 2015

average length of congestion in 2020 vs 2019
extra shared mobility vehicles in 2020 vs 2010

more jobs in 2019 vs 2010
more boarding train passengers in 2019 vs 2014